Ithaca High School Math Seminar Lesson 2-1
Date: 2023.10.31
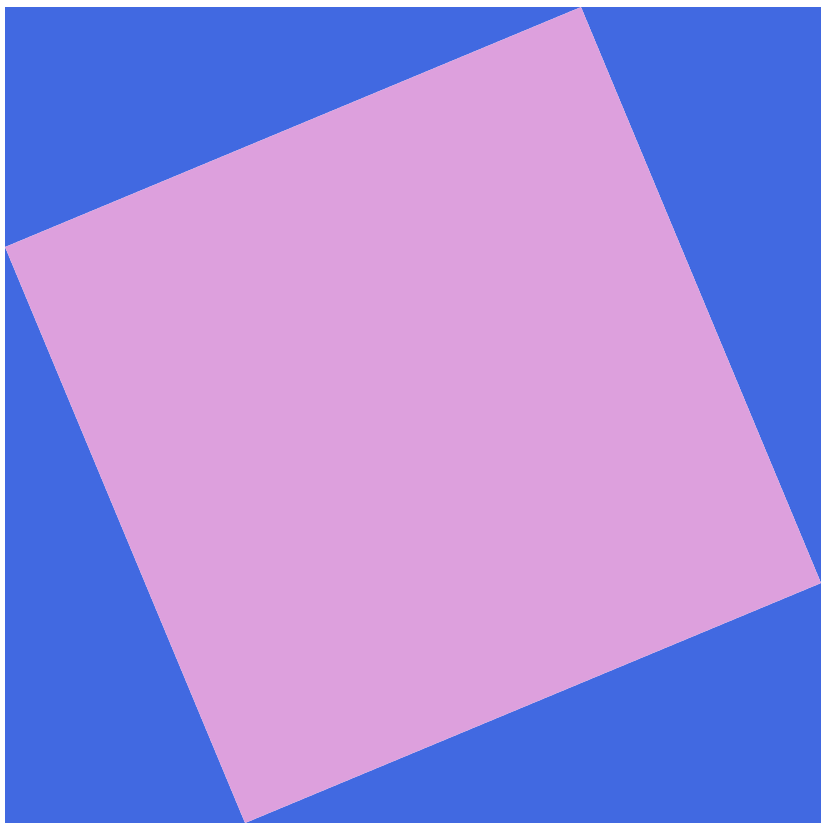
Today, from scratch, we'll use a web browser to create the following picture that is a proof of Pythagoras' Theorem. (Why this is a proof is homework, hints are at the bottom of this page.) This is a very simple image compared to graphics we will program later in the course, but we need to learn how to walk before we run!

Choosing a web browser as a tool to render graphics is generally a terrible decision (and we will switch to other tech in the third lesson). HOWEVER, for a simple graphic like this, making it in a browser is also simple and doesn't require much programming knowledge.
The goal of this lesson is to think about how to construct a precise but simple diagram using mathematics, and then get it on a screen.
Step 1: Drawing a rectangle in a web browser
Let's try and draw a rectangle on the screen ASAP from scratch. We will not need to use any external javascript libraries, microservices, or other miscellaneous web junk. We will simply create two files. We need a place to put them though.
Task: Create a folder on your computer to store the webpage files we will make.
The next steps require a text editor. If you already have experience with text editors, immediately skip to the task below. If not, there are a couple of things to know about text editors:
- They are programs which edit text files.
- Anyone who does any serious programming uses a text editor.
- The default text editors bundled with most operating systems typically have a limited number of features.
I recommend using one of the following text editors. They are all free.
If you have never used a text editor before, I recommend Sublime Text 4. The others are very powerful, but take significant time to learn how to use. We'll be using text editors a lot in future lessons. A default editor like Notepad on Windows will be sufficient for this lesson, but is an unacceptable long-term choice.
Potential Homework: If you do not have / use a text editor on your computer, choose and install a text editor before next class. Play around with it a bit before next class.
Rendering graphics in a web browser will require a webpage, so let's make one.
Task: Using a text editor, create a file containing the following html code. (You are welcome to copy-paste the code below.) Save it as pythagoras-theorem.html inside the folder you created above.
<!DOCTYPE html>
<html>
    <head><title>Pythagoras' Theorem</title></head>
    <body>
        <canvas id="drawing-area"></canvas>
        <script src="./draw.js"></script>
    </body>
</html>
Now let's create the javascript code to create our graphic.
Task: Using a text editor, create a file containing the following javascript code. (You are welcome to copy-paste it.) Save it as draw.js inside the folder you created above.
"use strict";

const canvas = document.getElementById('drawing-area');
const ctx    = canvas.getContext('2d');

canvas.width   = 500;
canvas.height  = 500;

ctx.fillStyle = "lightgray";
ctx.fillRect(0,0,500,500);

ctx.fillStyle = "crimson";
ctx.fillRect(100,100,100,100);
We should now have a webpage with graphics.
Task: Launch your favorite web browser (recommendation: Firefox) and open the page pythagoras-theorem.html you just created. The shortcut Ctrl-O does this for Firefox on Windows. If you don't see the image below, open the browser console (F12 on Firefox on Windows) and see what's wrong; you may have a typo in your code.
The webpage we made above is linked here and should look like this:

Task: Once working, modify the code in draw.js so that the web browser renders a rectangle with sides of different length. Make the rectangle larger and in the bottom-right corner. Change the color of the rectangle with this list of color keywords.
If you've finished the task above, you're ready to move on to Step 2. If you're curious about what the important lines in pythagoras-theorem.html are, they do the following:
- The 3rd line set the title of the the webpage, which the tab got its name from.
- The 5th line gave the webpage a
canvas, which we drew the rectangles on. - The 6th line told the webpage to run our rectangle-drawing code in
./draw.js.
The important lines in draw.js are as follows:
- The 1st line makes the browser report more errors in javascript code.
- The 3nd and 4th lines give us references to the canvas so we can draw 2D shapes.
- The 6th and 7th lines specify the size of the canvas.
- The
ctx.fillStylelines set a drawing color by using a color keyword. A full list of the (current) color keywords and their colors can be found in the link above. There are other ways of setting colors, but using keywords is simple. - The
ctx.fillRectlines draw rectangles.
Step 2: Dealing with ridiculous (but subtle) canvas zoom
We have a problem: on screens with a high density of pixels, (such as most 4K screens) the graphic above is not crisp but slightly blurry (such as on the screen on which I'm writing this sentence). This is one of millions of ludicrous design choices made about how web browsers should work... and another reason why we will be moving away from web browsers and javascript very soon. While we're in this swamp though, we may as well try and deal with the issue.
Task:Add the following block of code before the line which sets the the color to be lightgray in draw.js
// Ridiculous javascript nonsense to stop canvas zoom.
const scale   = window.devicePixelRatio;
canvas.width  = 500 * scale;
canvas.height = 500 * scale;
ctx.scale(scale,scale);
canvas.style.width  = 500 + 'px';
canvas.style.height = 500 + 'px';
The result is subtle, but differences like this are extremely important in computer graphics (and, obviously, in art). The difference is clear if we zoom in and examine the pixels being drawn, as the image below illustrates.

Choices like this in computer graphics can make a big difference whether something is considered "good" or "bad", even though people may not be able to pinpoint why. This is something to keep in mind.
Even if people cannot describe what is wrong with an image, they may still sense that something is off.
Step 3: Draw triangles, and hence the diagram
We'll create our diagram by drawing four triangles. If we know the vertices of a triangle, drawing it on a web canvas is straightforwards, as the code below illustrates. Replacing the line of code in draw.js which draws a colorful rectangle with
ctx.beginPath();
ctx.moveTo(0,0);
ctx.lineTo(200,0);
ctx.lineTo(300,100);
ctx.closePath();
ctx.fill();
gives us this page which looks like the following image.

The overall code in draw.js so far can be found by viewing the source code of the page linked above (shortcut Ctrl-U on Firefox) and then clicking on the javascript file.
Task:Replace the crimson rectangle line with the code above to your draw.js file, and verify the result gives you the image above. Modify the code so that the triangle takes up 25% of the background gray rectangle.
We can easily modify the triangle-drawing code to draw a right-angled triangle with two sides parallel to the axes.
We can make our diagram more customizable by using variables instead of concrete values. For example, by defining variables a,b and assigning them values with a = 100; and b = 200; the following code snippet produces the same image as above.
const a = 100;
const b = 200;
ctx.beginPath();
ctx.moveTo(0,0);
ctx.lineTo(2 * a, 0);
ctx.lineTo(a + b, a);
ctx.closePath();
ctx.fill();
Now we can vary the size of the triangle by changing the values of a and b instead of changing the parts of the code which define a path.
Task: Modify the triangle drawing code to use variables like in the code above. Create a right-angled triangle whose two smallest sides have length that differ by 10.
We are now ready to draw the diagram illustrated at the top of this webpage! You may find it useful to work out the coordinates of the diagram on paper before coding it.
Final task: Choose two colors, and a right-angled triangle with three different sides. Modify draw.js to create a version of the diagram at the top of this page with your triangle and your colors.
Homework: Explain why the diagram you've created can be used to prove Pythagoras' Theorem.
Homework hints (select to unhide):
- There are three different side lengths in the diagram, call them a, b, c. Calculate the areas of the overall square in terms of a, b, c in two different ways.
- The two different area expressions are equal to each other, so put an equality sign between the two and simplify. What do you get?