Ithaca High School Math Seminar Lesson 2-2
Date: 2023.11.06
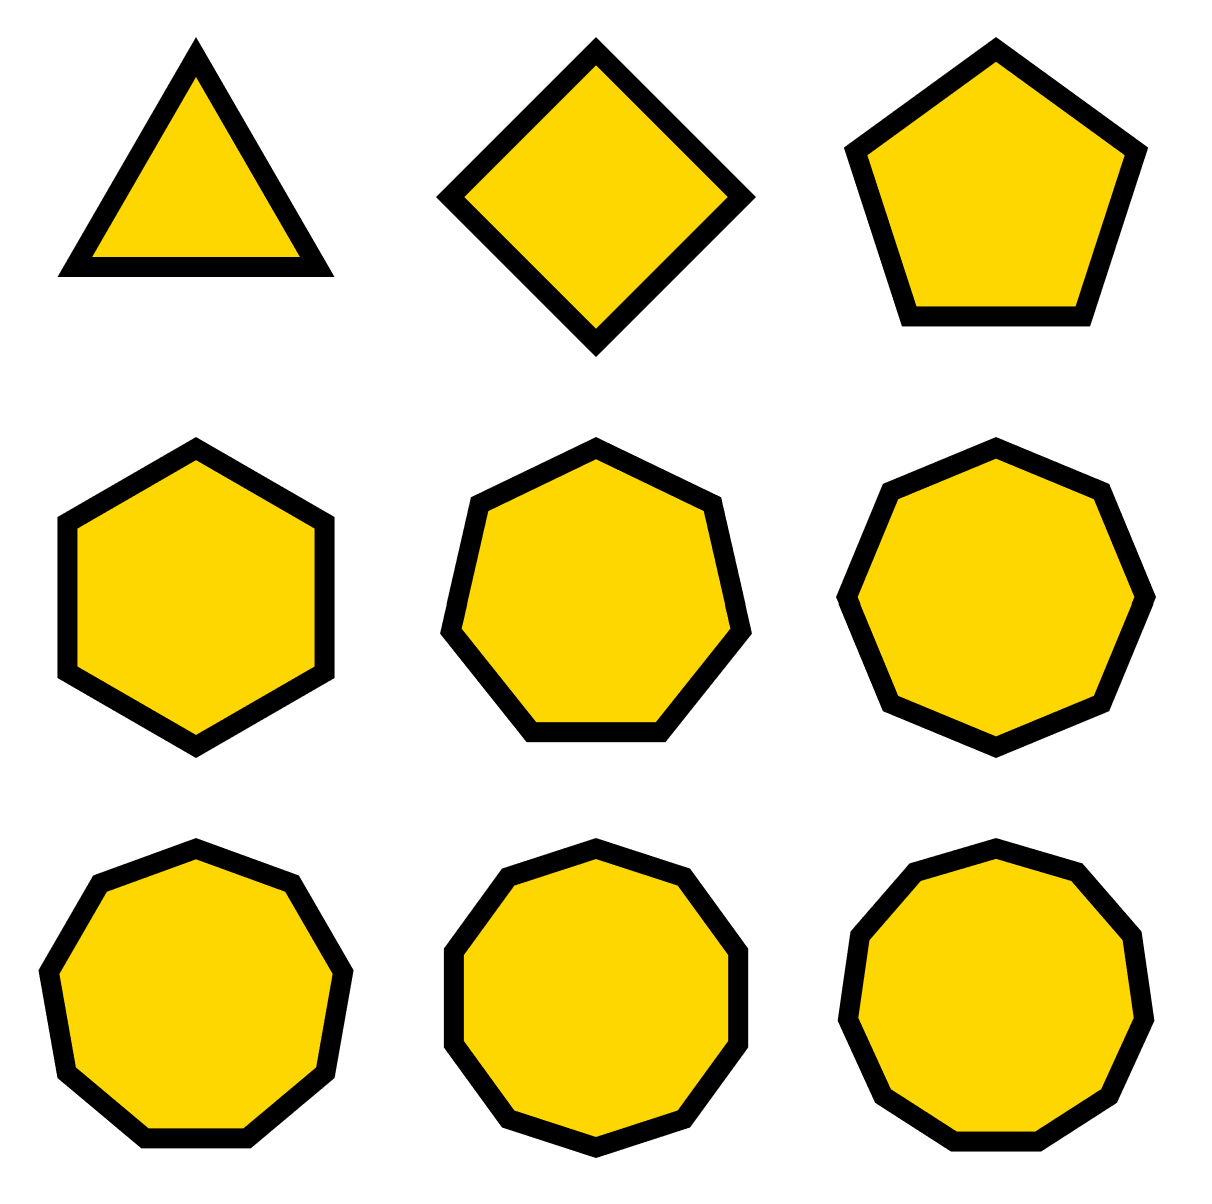
Regular polygons are shapes where all angles have the same size and all sides have the same size. Today we'll investigate some of their basic geometry, and render the first nine regular polygons to the screen. Like last lesson, we'll make the following image using a web browser, and do so from scratch.
Step 1: Determine the coordinates of regular polygons
Let's start by considering the coordinate geometry of the regular polygon with the smallest number of sides.
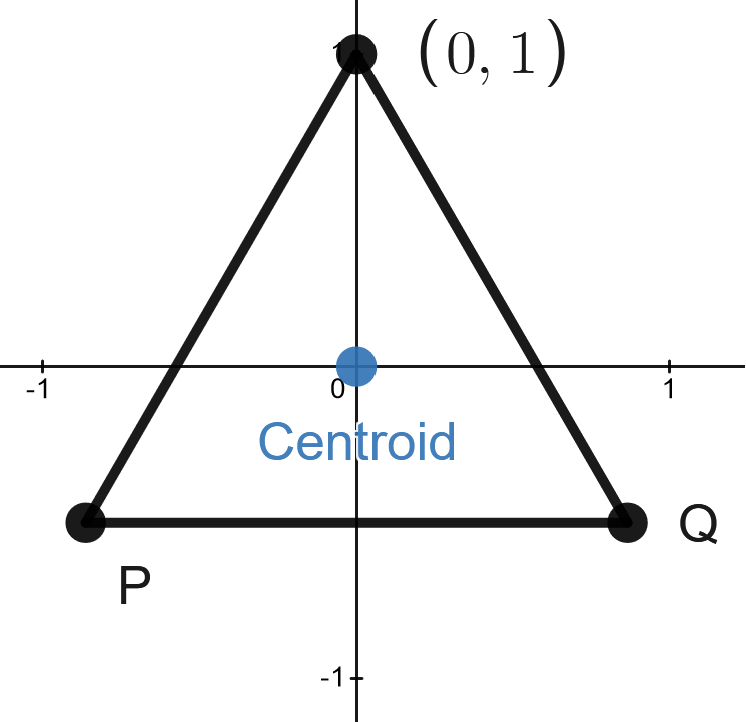
Task: Consider the equilateral triangle in the Euclidean plane with a vertex at (0,1) and with centroid (center) at the origin (illustrated above). What are the coordinates of the other vertices P, Q?
We will soon draw equilateral triangles on the screen, but to do this we need to know the coordinates of their vertices when they are away from the origin and have arbitrary size.
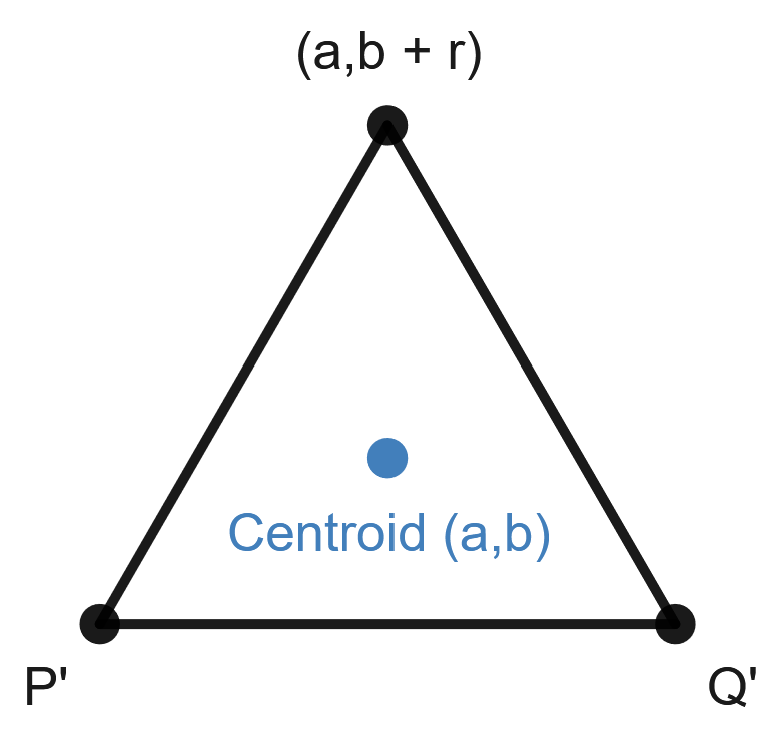
Task: Let a,b,r be real numbers with r > 0. Consider the equilateral triangle in the Euclidean plane with a vertex at (a,b + r) and with centroid (center) at (a,b) (illustrated above). What are the coordinates of the other vertices P', Q'?
Now let's consider a pentagon, from which we'll derive the general case.
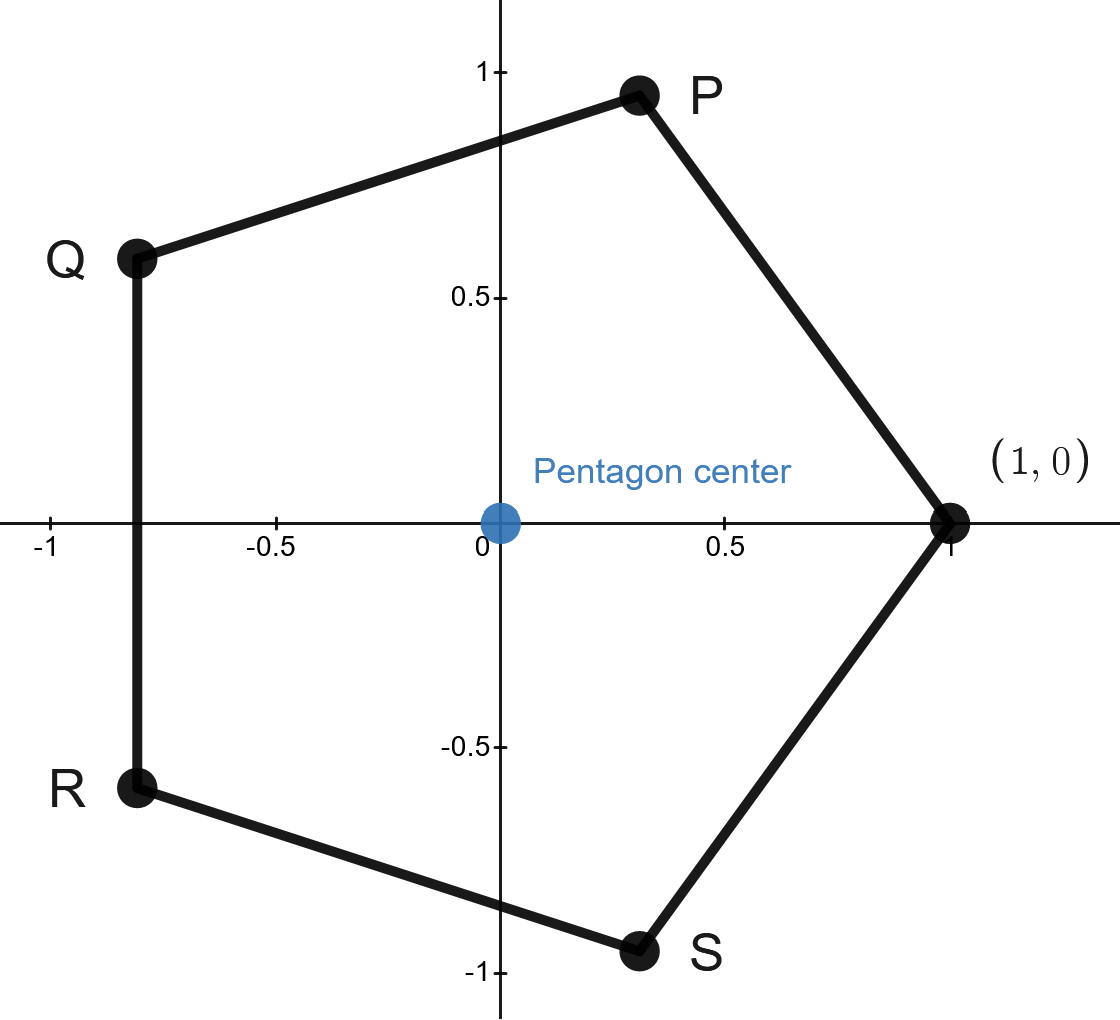
Task: For the pentagon in the Euclidean plane with a vertex at (1,0) and center located at the origin (illustrated above), what are the coordinates of the pentagon's other vertices P,Q,R,S?
Hints (select to unhide):
- Notice that the points P,Q,R,S all lie on the circle of radius 1 centered at the origin.
- Recall that every point on such a circle has coordinate (cos(t), sin(t)) where t is the angle traced out by the point from the positive x-axis.
Solution (select to unhide):
- P = (cos(2π/5), sin(2π/5))
- Q = (cos(4π/5), sin(4π/5))
- R = (cos(6π/5), sin(6π/5))
- S = (cos(8π/5), sin(8π/5))
Task: Consider how the pentagon example generalizes to a n-sided regular polygon (where n is some positive integer greater than 2). What are the coordinates of the vertices in the general case?
Step 2: Getting many regular polygons on the screen
Let's use the calculations above to get an equilateral triangle on the screen.
Task: Copy the folder from last lesson containing the webpage files used to make a visual proof of Pythagoras' Theorem; rename the .html file something like regular-polygons.html . (Alternatively, create a new folder, save the following text files to it: regular-polygons.txt, draw.txt, and then change their file extensions from .txt to .html and .js. respectively.) Use your calculations in Part 1 to modify the webpage to draw an equilateral triangle to the canvas. Remember that the vertical axis on the canvas is flipped!
You should get something like the following.

To efficiently draw our final image, we'll need to utilize two fundamental programming concepts: procedures and loops. We'll use procedures first.
Let's say we wanted to render the following image.
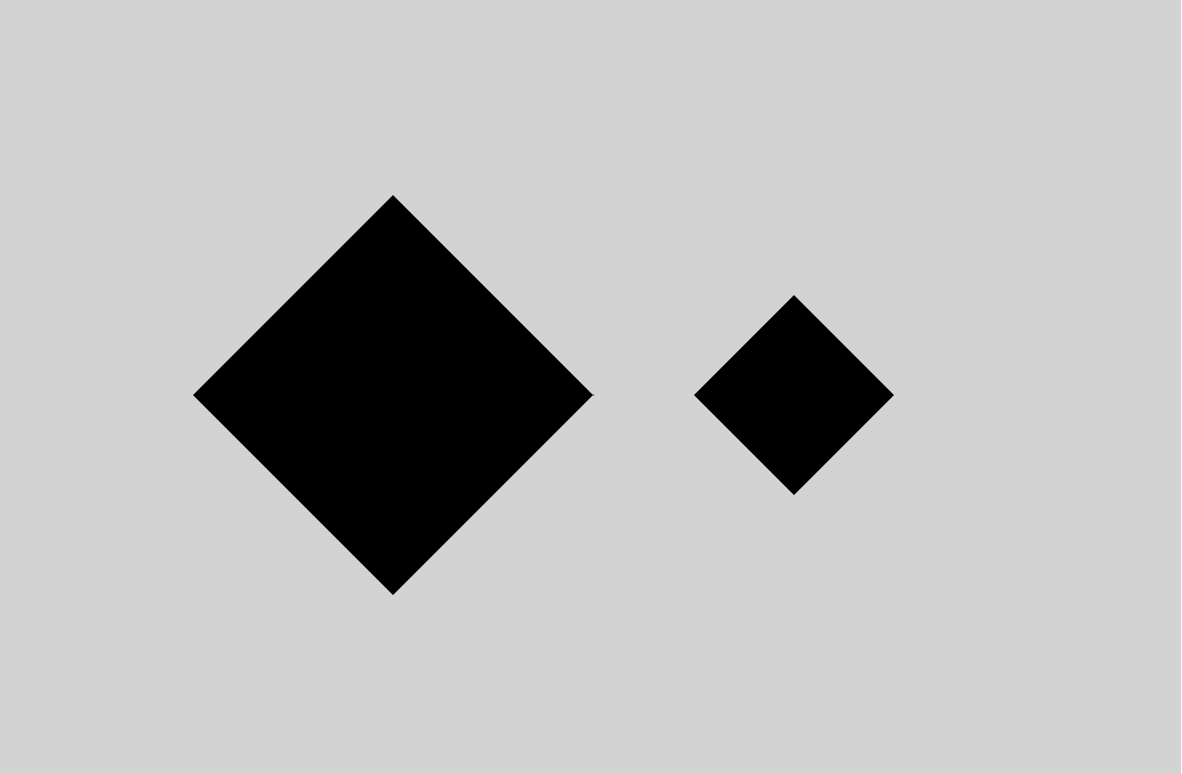
We could render the right diamond by copying the drawing code of the left diamond and then changing the coordinates. For example:
ctx.fillStyle = "black";
ctx.beginPath();
ctx.moveTo(300,200);
ctx.lineTo(200,300);
ctx.lineTo(100,200);
ctx.lineTo(200,100);
ctx.closePath();
ctx.fill();

ctx.beginPath();
ctx.moveTo(450,200);
ctx.lineTo(400,250);
ctx.lineTo(350,200);
ctx.lineTo(400,150);
ctx.closePath();
ctx.fill();
This is okay, but there's a more efficient and less error-prone way to render this image. (Namely, by defining and using a procedure.) A procedure can be thought of as code segment with parameters we can control. Procedures are often called functions, although they are completely different to functions in mathematics so we will avoid using such terminology.
The code below produces the same diamonds as above by using a procedure. First the procedure (draw_diamond) is defined in javascript by using the word function followed by the procedure name, and then a list of variables in parentheses that will be specified when the procedure is called (x, y, r). Once declared, we can call it to draw each diamond.
function draw_diamond(x,y,r) {
    ctx.fillStyle = "black";
    ctx.beginPath();
    ctx.moveTo(x + r, y    );
    ctx.lineTo(x    , y + r);
    ctx.lineTo(x - r, y    );
    ctx.lineTo(x    , y - r);
    ctx.closePath();
    ctx.fill();
}

draw_diamond(200,200,100);
draw_diamond(400,200,50);
The final two lines run the lines of code within the procedure twice, first with x, y, r set to 200, 200, 100, and then with x, y, r set to 400, 200, 50.
Task:Bundle your equilateral drawing code up into a procedure (called e.g. draw_equilateral), and then call the procedure to draw triangles of different sizes in different locations.
Procedures often reduce code size and often make code easier to read. There is another programming technique we can use to draw several shapes often achieves similar aims. Consider the following image.
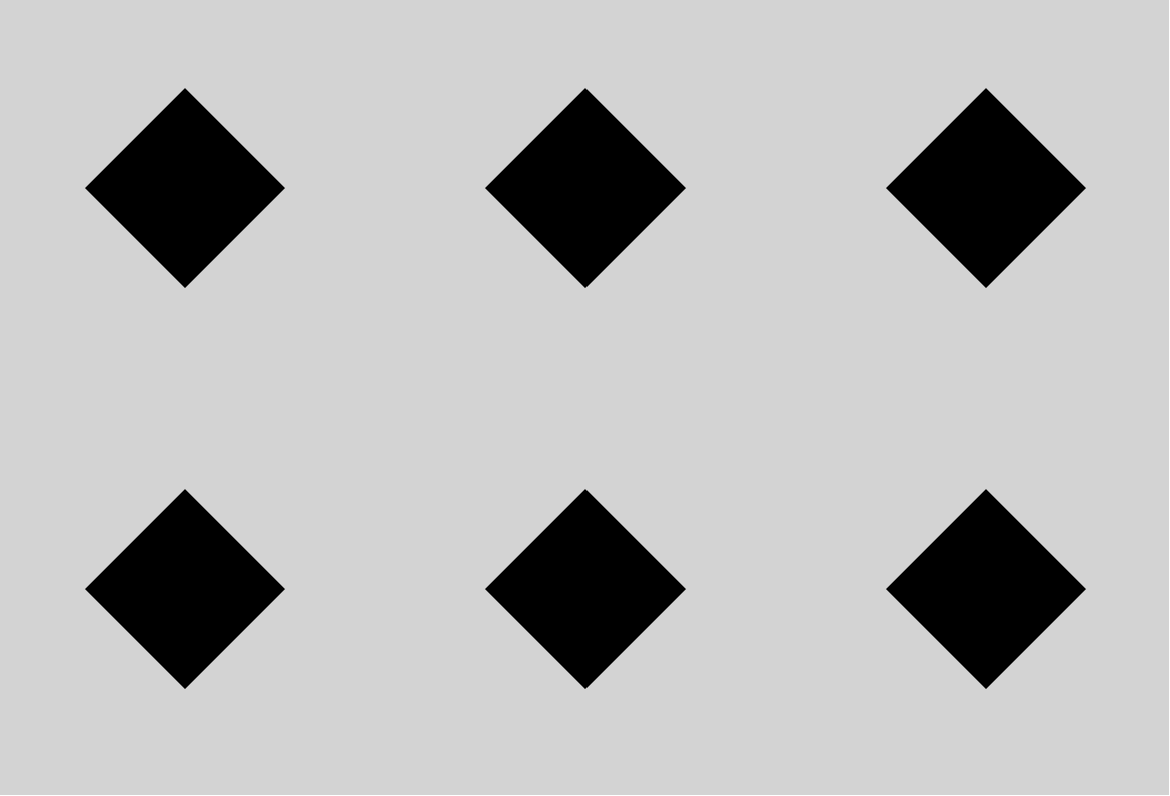
We could render this by calling draw_diamond six times times.
draw_diamond(100,100,50);
draw_diamond(100,300,50);
draw_diamond(300,100,50);
draw_diamond(300,300,50);
draw_diamond(500,100,50);
draw_diamond(500,300,50);
Every two lines, the x-coordinate of the diamond center increases by 200. In other words, calling the first three lines is just calling the lines draw_diamond(100 + 200 * i, 100, 50) and draw_diamond(100 + 200 * i, 300, 50) where i is an integer ranging from 0 to 2. This is exactly the kind of situation a for loop can help simplify. The following code produces the same result as the above 6 lines.
for (var i = 0; i < 3; i += 1) {
    draw_diamond(100 + 200 * i,100,50);
    draw_diamond(100 + 200 * i,300,50);
}
The syntax basically means the following:
var i = 0declares a new variableiand sets it to 0.i < 3determines whether the code in the loop runs: ifiis less than 3, the code in the loop runs, otherwise the loop exits.i += 1is what happens at the end of each loop, i.e.iis increased by 1 each time the code is run.
The net result is that the loop code is first run with i set to 0, which draws the diamonds in the first column. i increases from 0 to 1 and then the loop code runs again, drawing the diamonds in the second column. i is increased by 1 to 2, and the loop code runs again, drawing the diamonds in the third column. i is then increased to 3, but now i < 3 is not true, so the loop ends.
We can simplify the loop code. Within the for loop, the y-coordinates in the draw_diamond calls differ by 200, but otherwise the lines are the same. As such, we can add a for loop inside the for loop so that we iterate over the y-coordinates and the x-coordinates. The following code produces the same result as the previous for loop.
for (var i = 0; i < 3; i += 1) {
    for (var j = 0; j < 2; j += 1) {
        draw_diamond(100 + 200 * i, 100 + 200 * j, 50);
    }
}
Note that we have used different variables for each loop (i, j); unexpected behavior would happen if we used the variable i for each loop.
Task: Using for loops and your equilateral triangle procedure, create a large grid of triangles. (Feel welcome to copy the above loop code and modify it as necessary.)
Step 3: Creating a procedure to draw general regular polygons
Based on the pentagon calculations in Part 1, we can construct a procedure for drawing a pentagon:
function draw_pentagon(x,y,r) {
    const pi = 3.14159
    ctx.fillStyle = "crimson";
    ctx.beginPath();
    ctx.moveTo(x + r, y);
    ctx.lineTo(x + r * Math.cos(2 * pi / 5), y + r * Math.sin(2 * pi / 5));
    ctx.lineTo(x + r * Math.cos(4 * pi / 5), y + r * Math.sin(4 * pi / 5));
    ctx.lineTo(x + r * Math.cos(6 * pi / 5), y + r * Math.sin(6 * pi / 5));
    ctx.lineTo(x + r * Math.cos(8 * pi / 5), y + r * Math.sin(8 * pi / 5));
    ctx.closePath();
    ctx.fill();
}
Four of the middle lines differ only in two places, and they way in which they differ form a pattern...
Task: Copy the draw_pentagon procedure above into your drawing code. Use a loop to simplify the four ctx.lineTo lines in the procedure.
Notice that there is nothing particularly special about the number 5 in the code above too...
Task: Rename draw_pentagon to draw_regular_polygon and give it another variable n representing the number of sides. Modify the code so that the procedure draws a n-sided regular polygon. Test the procedure by calling it with different values for n.
We are almost done! Our draw_regular_polygon procedure combined with loops allows us to draw different polygons in different locations. For example, the code
for (var i = 0; i < 3; i += 1) {
    draw_regular_polygon(100 + 150 * i, 100, 50, i + 3);
}
Gives the following image

Final task:Choose a border color and a fill color (e.g. using this list). Create the image at the top of this page where the shapes have your chosen border and interior colors.
Hints (select to unhide):
- Creating a shape with a border is just a matter of drawing two shapes on top of each other. In the loop, draw the smaller shape after the larger shape, and remember to change colors.
- The shapes in the image at the top have vertices pointing to the top of the page. If a polygon has a vertex pointing to the right, rotating it by π/2 will point it upright.
Homework: Download KodeLife. KodeLife is available for free at its official website. Open KodeLife to test that it is working.