Ithaca High School Math Seminar Lesson 2-4
Date: 2023.11.13
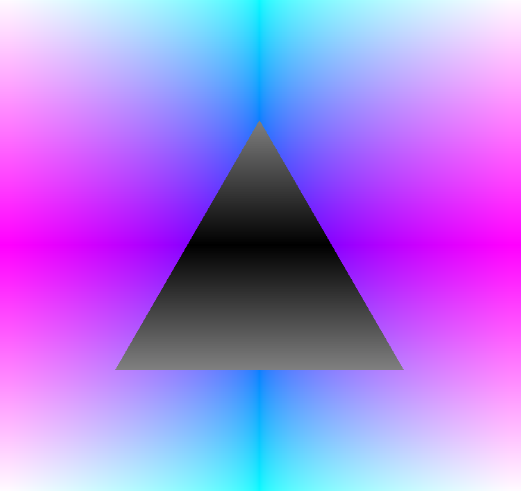
Today we will examine examples of how to specify regions in the Euclidean plane using conditions on points, and then adapt them in fragement shaders to create an image like the following.
Step 1: Graphing regions in the Euclidean plane by hand
Let's first get some practice graphing regions in the plane.
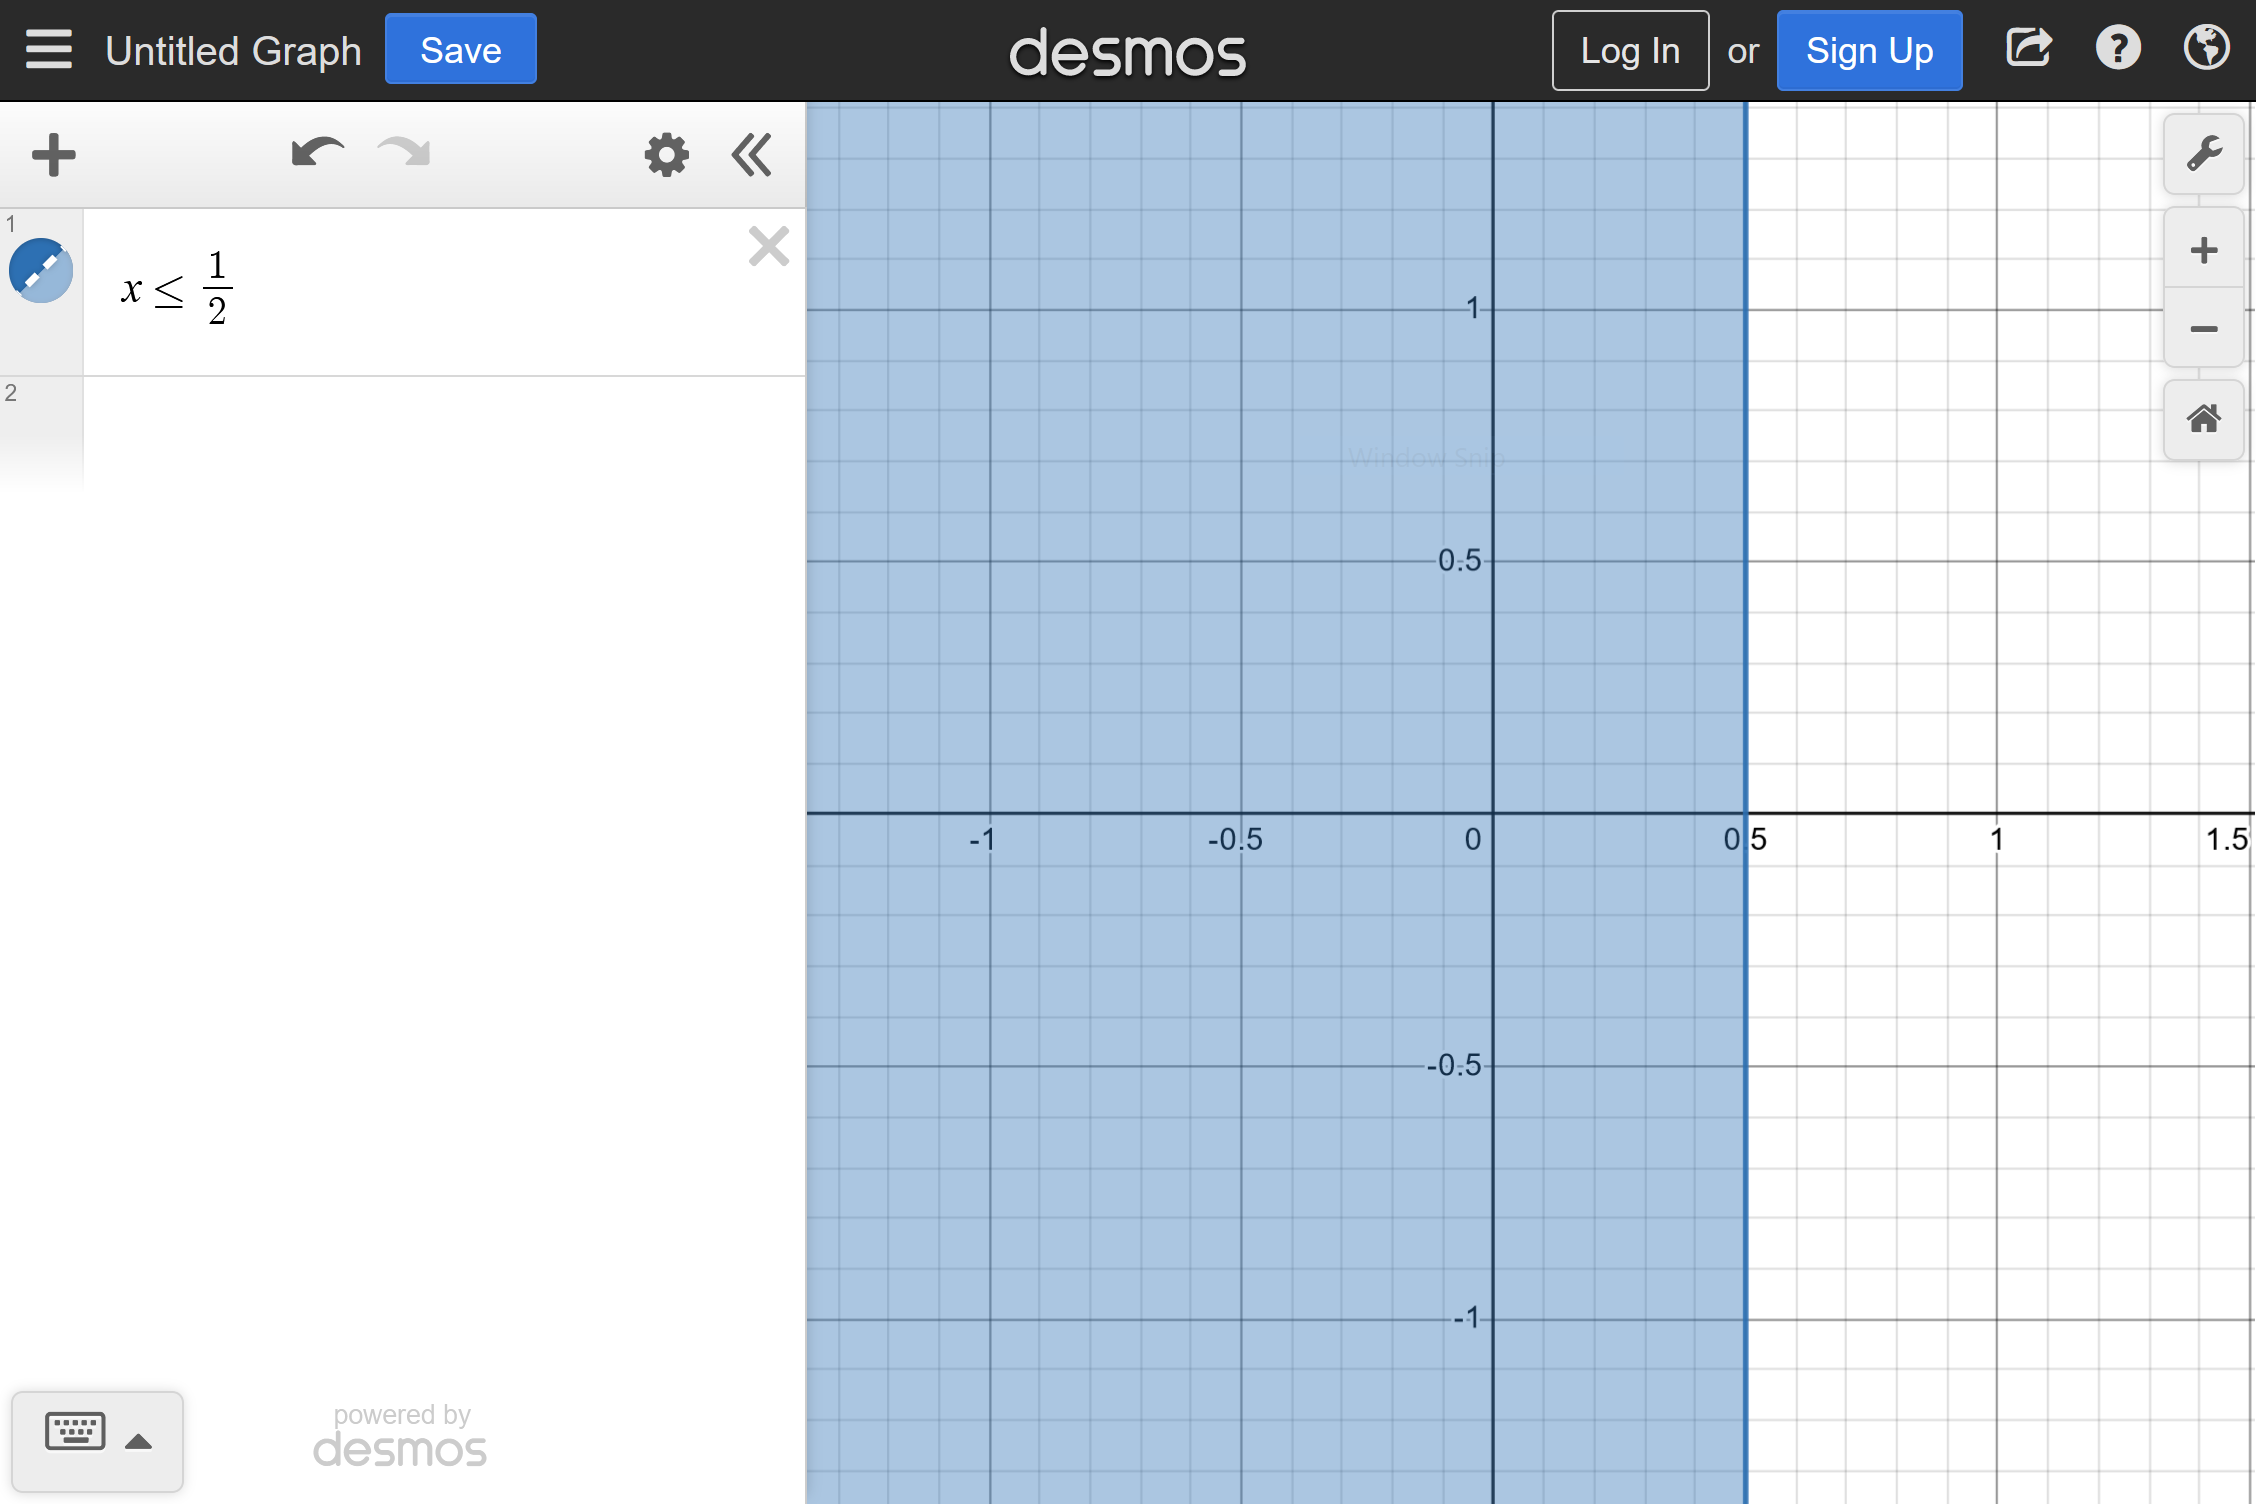
We can think of regions in the plane as sets of points, for example $$ R_a = \{ (x,y) : x \leq 0.5 \}. $$ If you haven't seen this type of notation before, it's not nearly as bad as you may think. It can be translated into English as "Ra is equal to the set of points (x,y) for which x is less than or equal to 0.5".
Graphing this by hand is straightforwards, and it should be easy to visualize the region in any decent graphing tool. Using Desmos and entering the equation x ≤ 0.5 into the sidebar gives a plot like the following.
Similarly the region $$ R_b = \{ (x,y) : xy \leq 0.25 \} $$ can be visualized in Desmos.
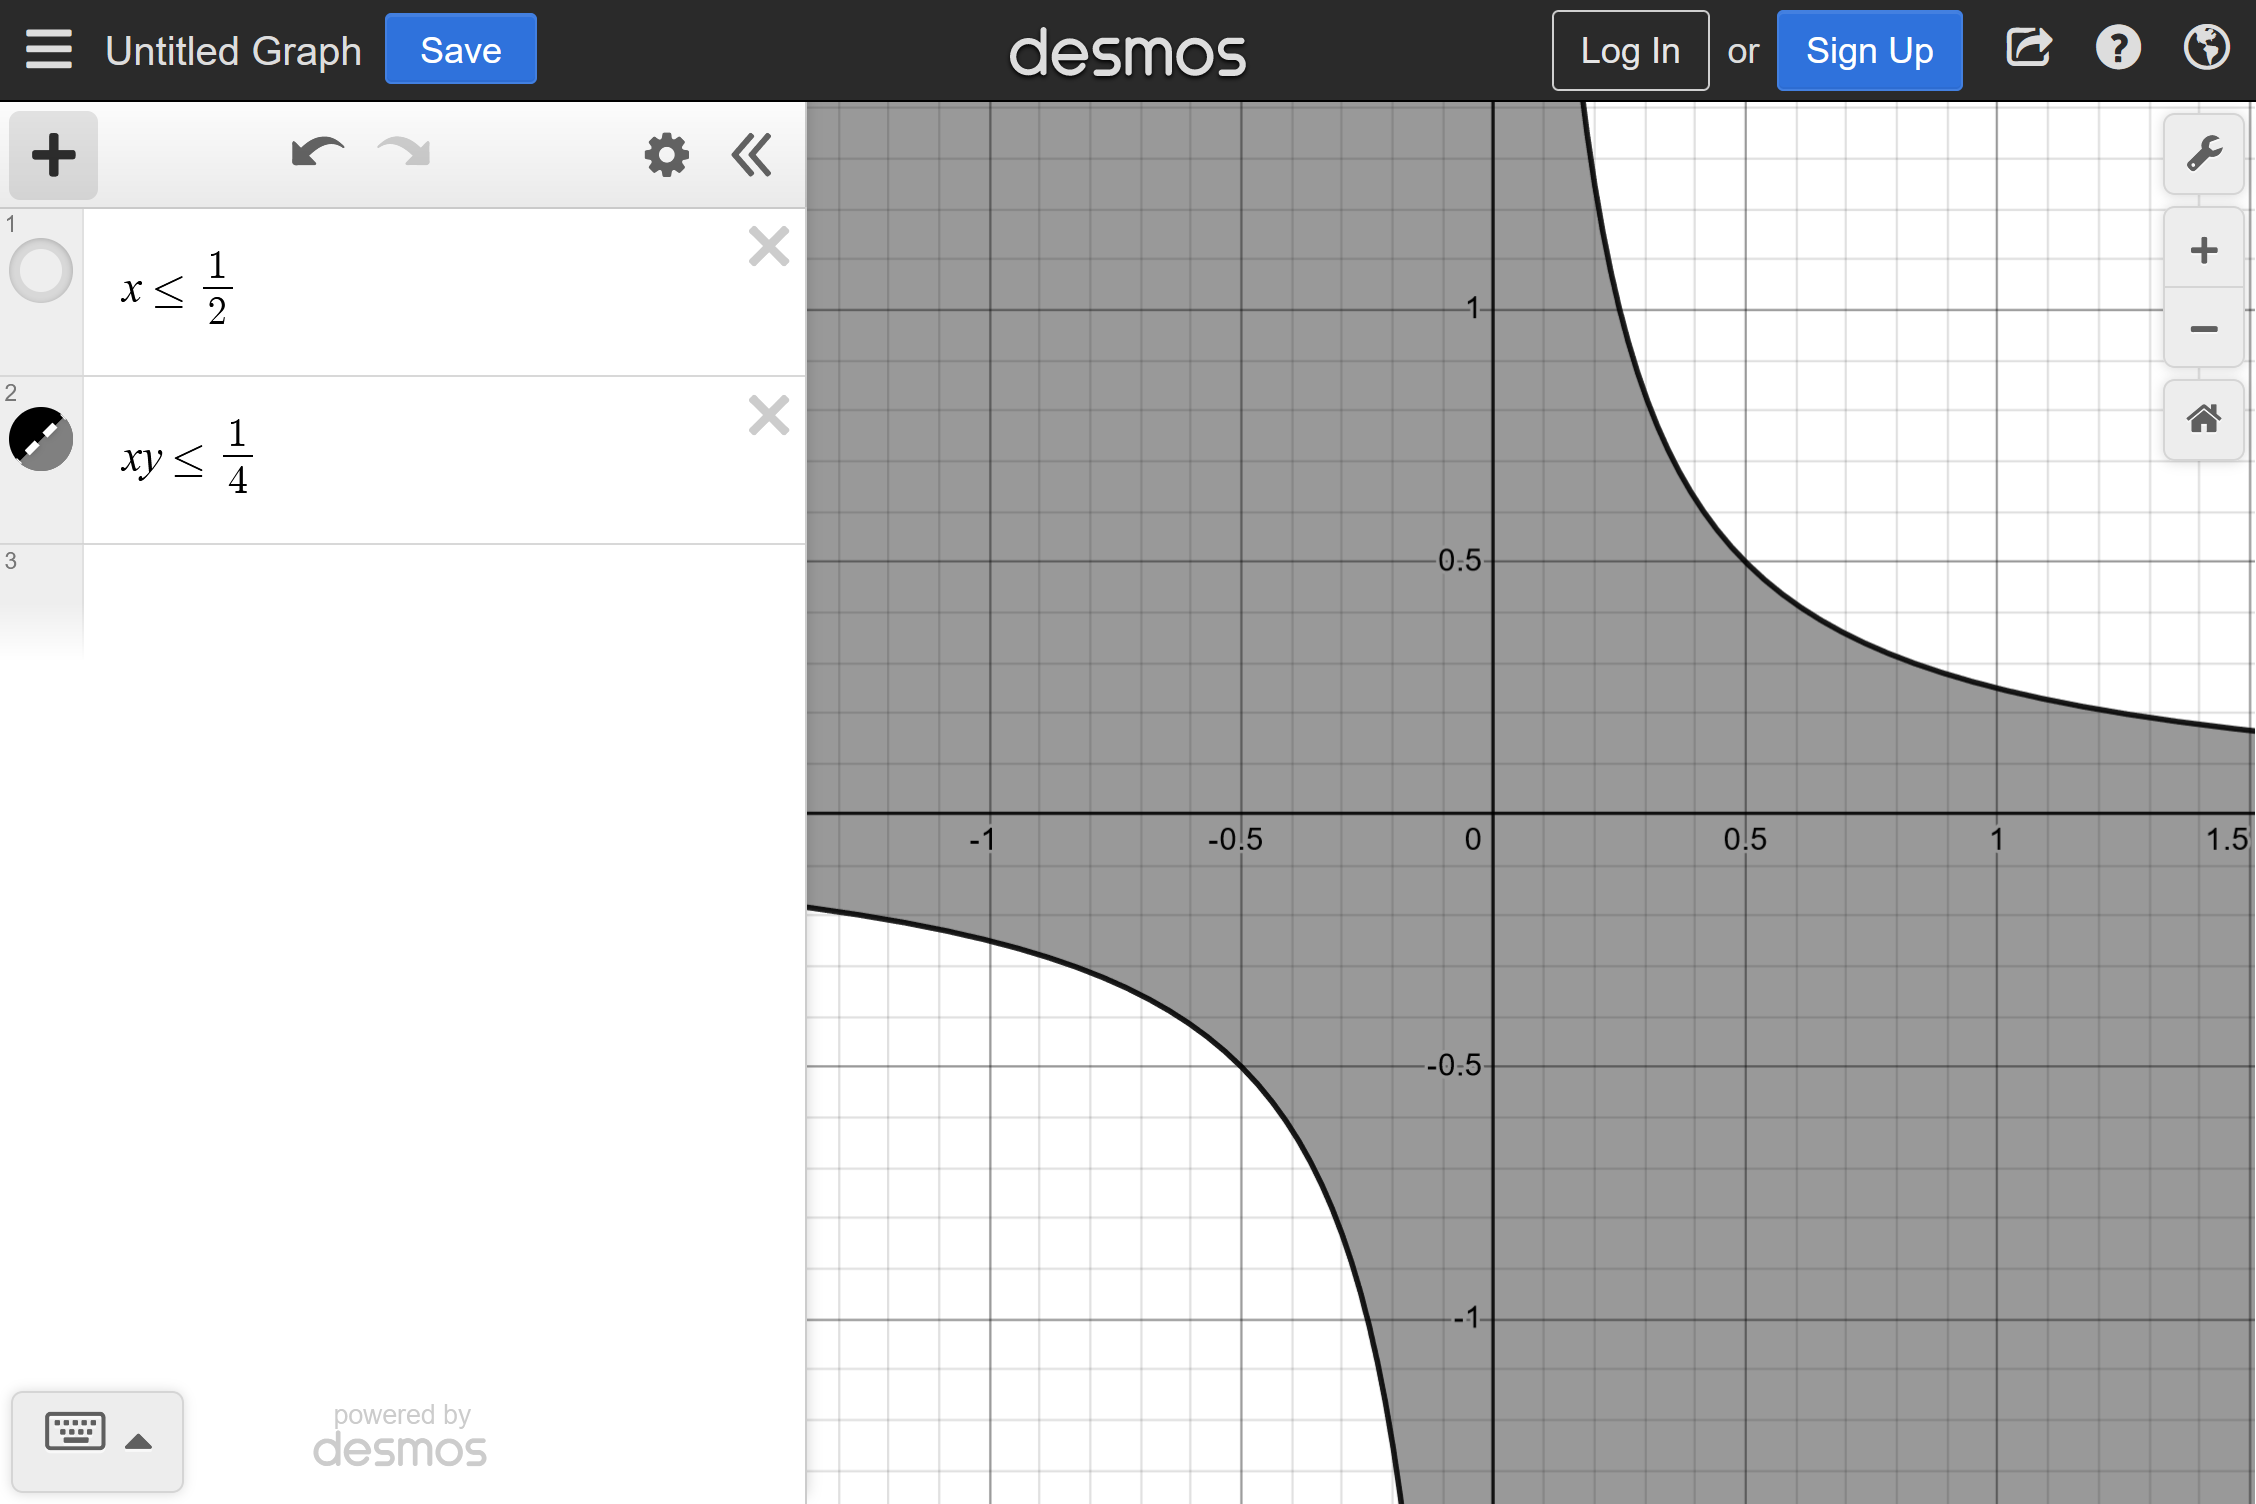
Note that we disabled the first region we specified; there was no need to replace it.
Task: Try sketching the regions below by hand on paper (or using a digital equivalent), without using a graphing tool. Compare your sketches with your neighbors. Then check your plots by drawing the regions in your favorite graphing tool.
$$ \begin{equation*} \begin{split} R_1 &= \{ (x,y) : x \leq y \}, \\ R_2 &= \{ (x,y) : x + y \leq 1 \}, \\ R_3 &= \{ (x,y) : x^2 + y^2 \leq 0.25 \}, \\ R_4 &= \{ (x,y) : \arctan(y/x) \leq \pi/4 \}, \\ R_5 &= \{ (x,y) : |y| \leq |x| \}, \\ R_6 &= \{ (x,y) : \max(|x|,|y|) \leq 0.5 \}. \\ \end{split} \end{equation*} $$
Step 2: Define regions in a fragment shader
The following fragment shader code
#version 330
uniform vec2 resolution;
void main(void)
{
    float screen_ratio = resolution.y / resolution.x;
    float xc = 2 * gl_FragCoord.x / resolution.x - 1;
    xc /= screen_ratio;
    float yc = 2 * gl_FragCoord.y / resolution.y - 1;

    vec4 color1  = vec4(0,0,1,1);
    vec4 color2  = vec4(0.8,0.8,0.8,1);

    bool in_R = xc * yc <= 0.25;

    gl_FragColor = float(in_R) * color1 + float(! in_R) * color2;
}
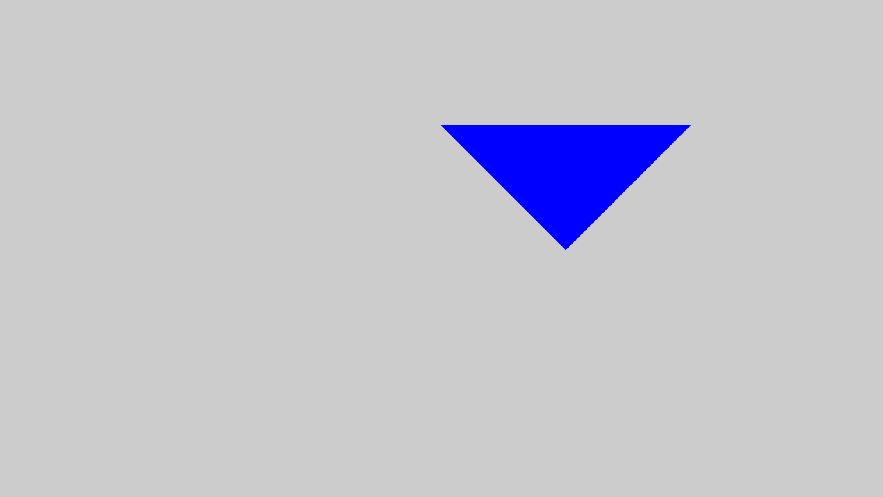
produces the following image.

Task: Open up KodeLife, and delete all the default code. Copy-paste in the above code. What you see next depends on the graphics hardware you have in your computer (e.g. your GPU). If you do not see the image above, go to the right sidebar and try adjusting the drop-down menu value in Project → Properties → Renderer to OpenGL Core or OpenGL Compatibility. (Upon such a change, you may need to delete the default code and replace it with the copied code above.)
The above image is a graph of the region Rb (specified earlier) where the y-coordinates of the graph vary from -1 to 1, and the x coordinates vary at the same scale. (Their range will be determined by the resolution in the right sidebar in Project → Properties → Resolution.)
The line of code in the above fragment shader that actually determines the shape of the hyperbola is
bool in_R = xc * yc <= 0.25;
This defines a new boolean (a variable which is either true or false) with the name in_R, calculates the boolean value on the right side of the = sign, then assigns this value to in_R. To calculate the expression on the right side of the = sign, the (scaled) product of the pixel coordinates xc * yc is calculated, then compared with 0.25. If the value of the product is less than or equal to 0.25, in_R is set to true, otherwise it is set to false. If true, the color of the pixel is set to the value of color1, otherwise it is set to color2.
Task: Modify the expression on the right of the = sign in the line above to produce a graph of each of the regions in Step 1. Note: the symbol ^ has a different meaning in most programming languages to exponentiation, so when creating the graph of the circle just use multiplication instead. Similarly the absolute value signs | mean something different too, so just use the absolute value function abs() instead.
The regions we have looked at so far have been given by single conditions, but we can easily define regions given by multiple conditions. For example, the region of the plane given by $$ R_c = \{ (x,y) : y \leq 0.5, \; y \geq 0.5 - x, \; y \geq x - 0.5 \} $$ are all the points (x,y) which simultaneously satisfy all of the conditions.
We can use the and operator (&&) to specify such a region in a fragment shader.
By changing the same line as in the previous task to instead be
bool in_R = yc <= 0.5 && yc >= 0.5 - xc && yc >= xc - 0.5;
we get the following image.
Up until now the variables color1 and color2 have been constant, but there is no reason they need to be: we can make the colors depend on xc and yc like in the previous lesson to make them have gradients.
Final task: Referring back to the lesson 2-3 (and 2-2) if necessary, create your own version of the image at the top of this page. The sqrt() function may be helpful.